Общий каталог Sumitomo 2018 - 2019 - страница 578
Навигация
 Общий каталог Sumitomo 2012
 Каталог Sumitomo резьбонарезной инструмент
 Каталог Sumitomo пластины с режущей кромкой-моноалмаз Sumicristal
 Каталог Sumitomo инструмент для обработки канавок
 Общий каталог Sumitomo 2019 - 2020
 Каталог Sumitomo запасные части
- Pages 3-6_CS6_EN_web
- A 1-20 insert selection EN_web
- B 1-14 grades_EN_web
- C01-17 inserts intro pages_EN_web
- C18-56 negative inserts_EN_web
- C57-86 positive inserts_EN_web
- D 1-46 tool holders_EN_web
- E 1-24 boring bars_EN_web
- F 1-48 grooving_thread tools_EN_web
- G 1-54 milling cutters_EN_web
- H 1-48 insert type endmills_EN_web
- J 1-24 new endmills_EN_web
- J 25-50 endmills_EN_web
- K 1-46 Multi-Drills_EN_web
- K 47-76 Multi-Drills_EN_web
- L 1-28 cbn_pcd grades_EN_web
- M 1-34 cbn_pcd inserts_EN_web
- M 35-56 SHM tools_EN_web
- N1-24 technical guidance_EN_web
- P 1-8 spare parts_neu_EN_web
- P 9-22 index_notes_EN_web
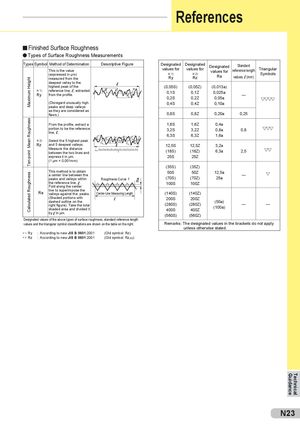
Finished Surface Roughness
Types of Surface Roughness Measurements
| Types | Symbo | l Method of Determination | Descriptive Figure | Designated | Designated | Designated | Standard | |
| ht | This is the value (expressed in µm) measured from the | values for h1) Ry | values for h2) Rz | values for Ra | reference length values,l(mm) | Triangular Symbols | ||
| ximum Heig | h1) Ry | deepest valley to the highest peak of the reference line,l, extracted from the profile. | (0,05S) 0,1S 0,2S | (0,05Z) 0,1Z 0,2Z | (0,013a) 0,025a 0,05a | — | ||
| Ma | (Disregard unusually high peaks and deep valleys | 0,4S | 0,4Z | 0,10a | ||||
| as they are considered as flaws.) | 0,8S | 0,8Z | 0,20a | 0,25 | ||||
| ness | From the profile, extract a | 1,6S | 1,6Z | 0,4a | ||||
| ugh | portion to be the reference | 3,2S | 3,2Z | 0,8a | 0,8 | |||
| n Ro | line,l. | Yp1 Yp2 Yp3 Yp4 Yp5 m | 6,3S | 6,3Z | 1,6a | |||
| Mea | h2) Rz | Select the 5 highest peak and 5 deepest valleys. | Yv1 Yv2 Yv3 Yv4 Yv5 | 12,5S | 12,5Z | 3,2a | ||
| en-point | Measure the distance between the two lines and express it in µm. (1 µm = 0,001mm) | (Yp1+Yp2+Yp3+Yp4+Yp5)+(Yv1+Yv2+Yv3+Yv4+Yv5) 5 Rz= | (18S) 25S | (18Z) 25Z | 6,3a | 2,5 | ||
| T | (35S) | (35Z) | ||||||
| ughness | This method is to obtain a center line between the peaks and valleys within the reference line,l. Fold along the center | Roughness Curve f | 50S (70S) 100S | 50Z (70Z) 100Z | 12,5a 25a | — | ||
| Calculated Ro | Ra | line to superimpose the valleys against the peaks. (Shaded portions with dashed outline on the right figure). Take the total shaded area and divided it bylin µm. | Center-Line MeasuringLength | (140S) 200S (280S) 400S (560S) | (140Z) 200Z (280Z) 400Z (560Z) | (50a) (100a) | — | — |
Designated values of the above types of surface roughness, standard reference length values and the triangular symbol classifications are shown on the table on the right. Remarks: The designated values in the brackets do not apply unless otherwise stated.
| 1) Ry | : According to new JIS B 0601:2001 | (Old symbol: Rz) | ||
| h | ||||
| Rz | : According to new JIS B 0601:2001 | (Old symbol: Rz | ) |
h 2) JIS