Общий каталог Mitsubishi 2020 - 2021 - страница 1755
Навигация
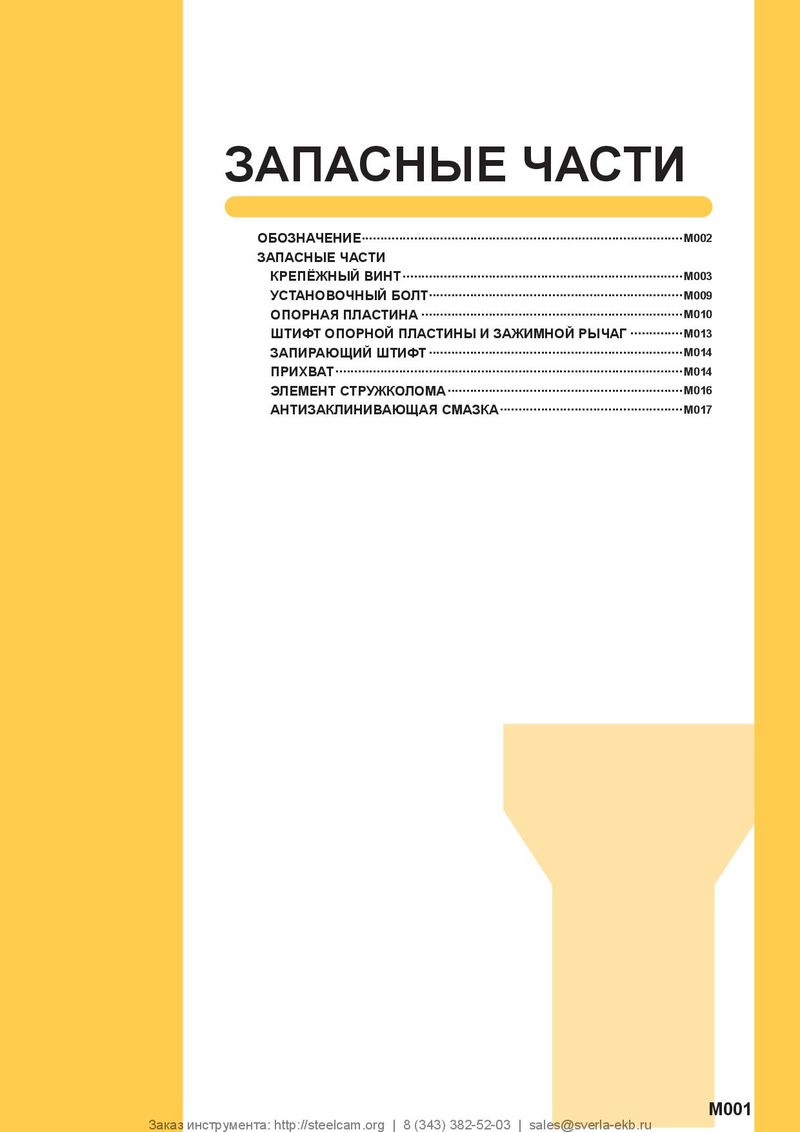 Каталог Mitsubishi Materials запасные части
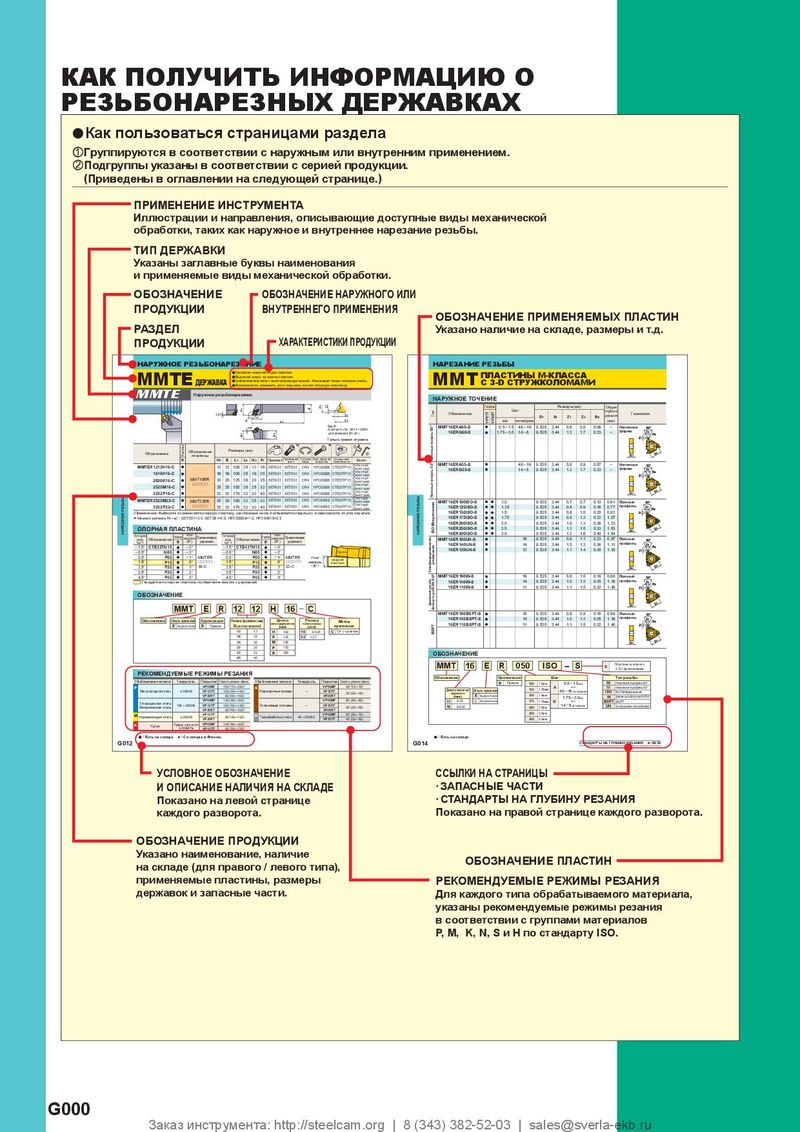 Каталог Mitsubishi Materials резьбонарезной инструмент
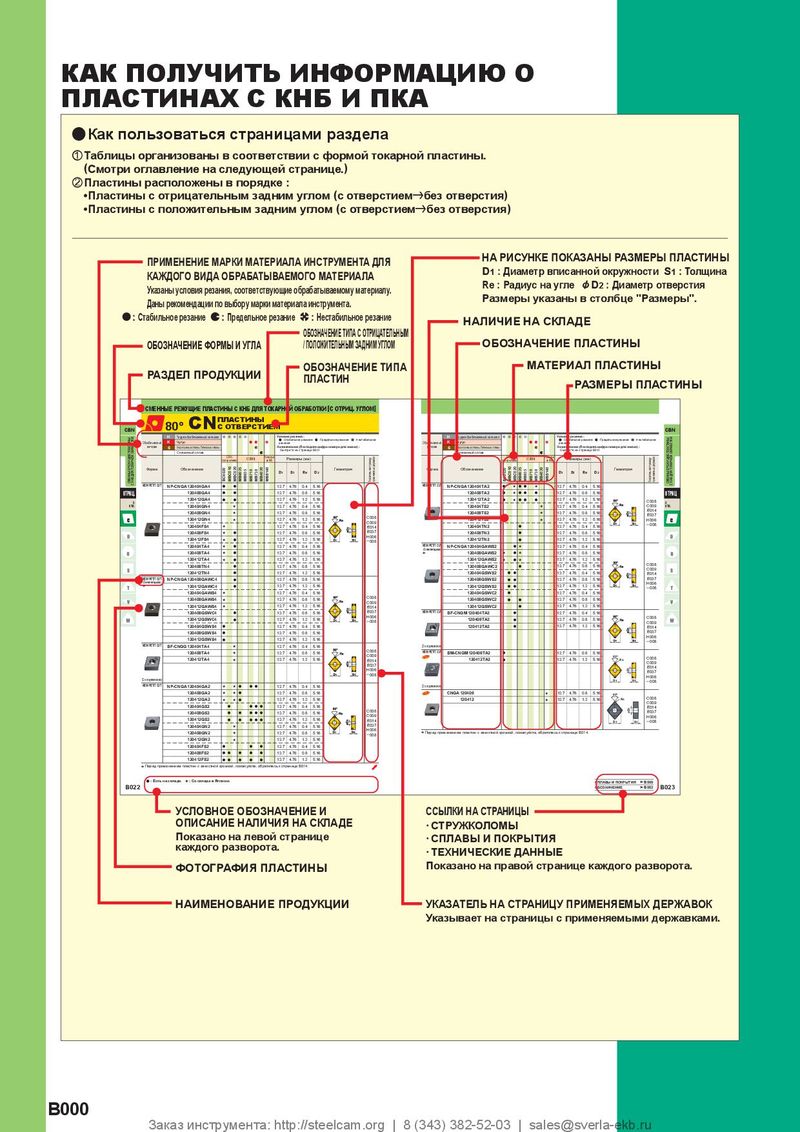 Каталог Mitsubishi Materials СНП с CBN и PCD для токарной обработки
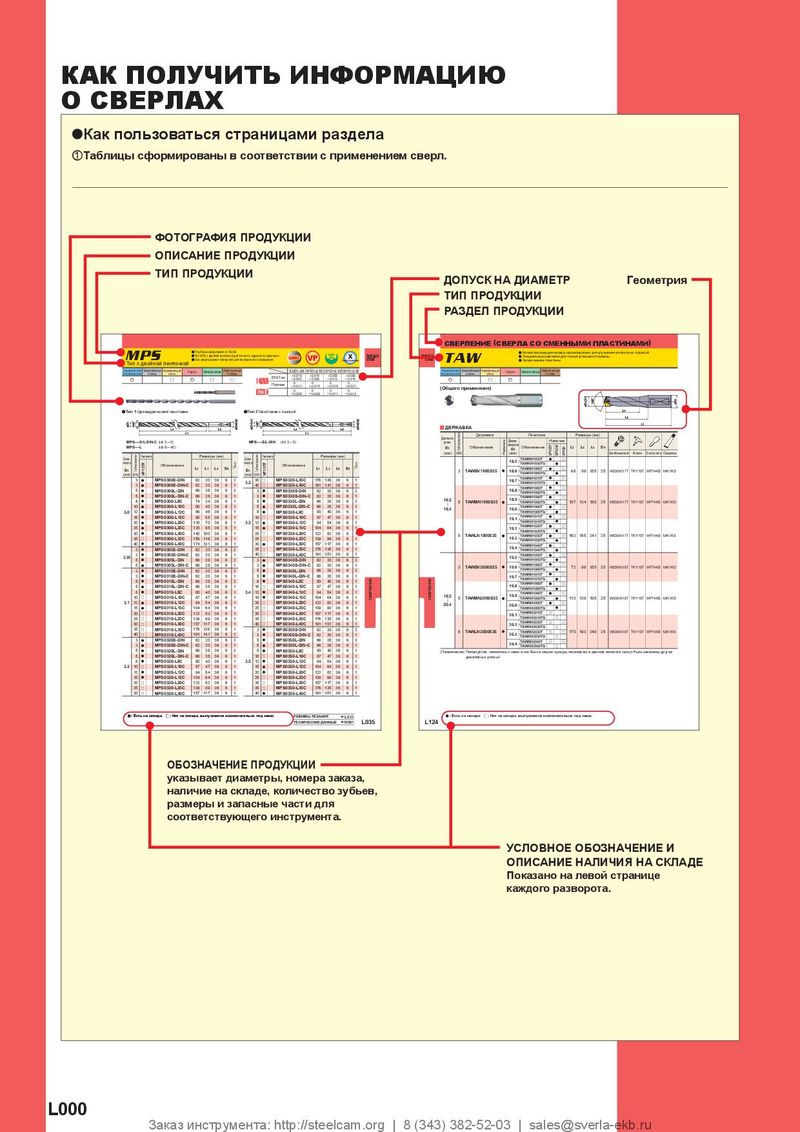 Каталог Mitsubishi Materials сверлильные инструменты
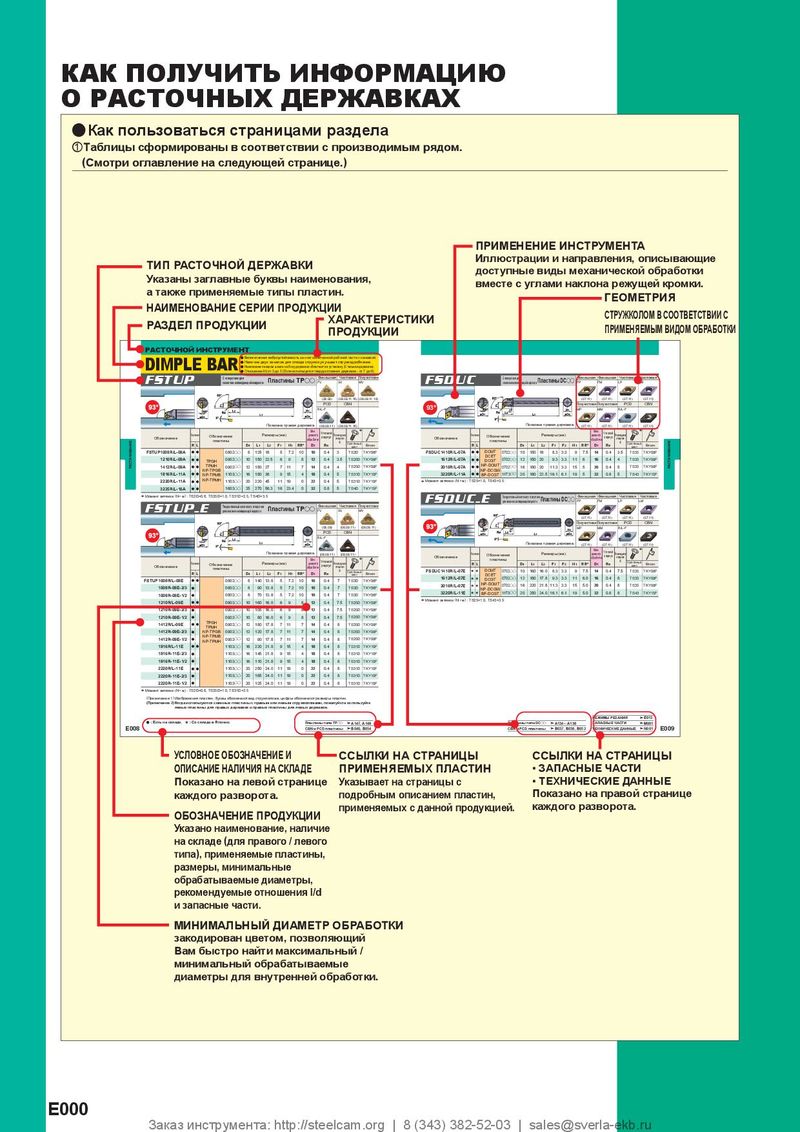 Каталог Mitsubishi Materials расточной инструмент
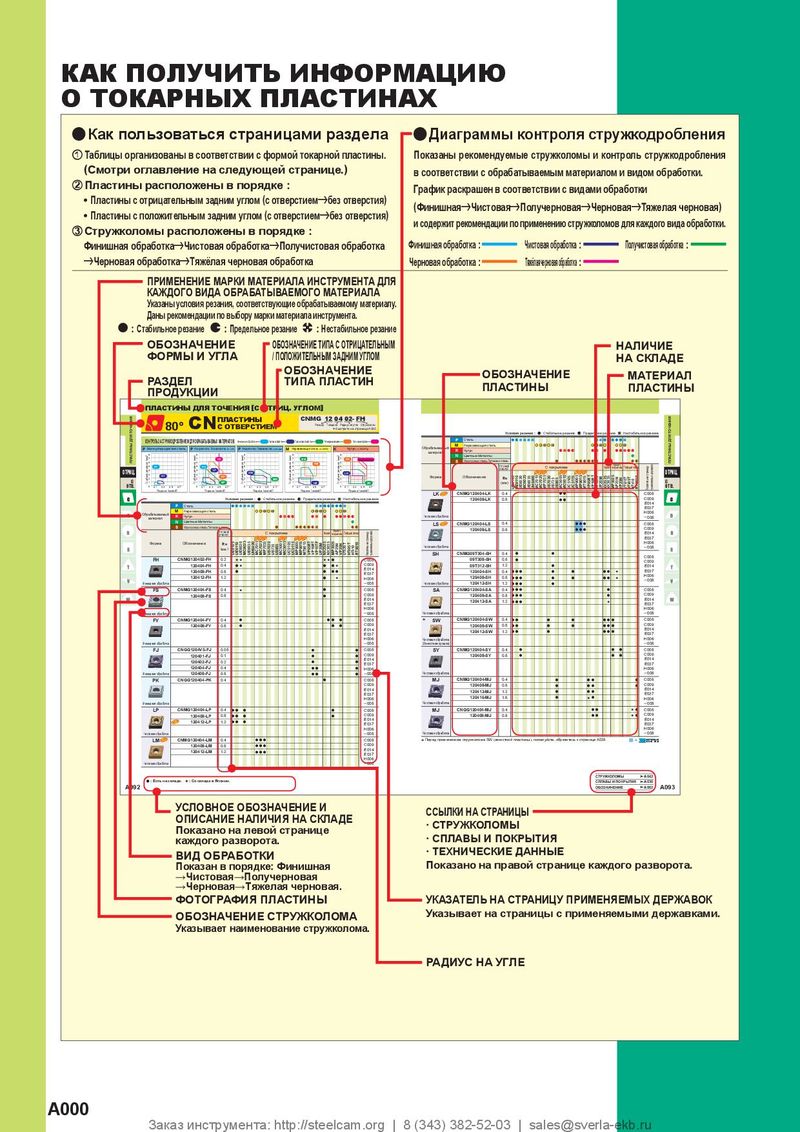 Каталог Mitsubishi Materials пластины для точения
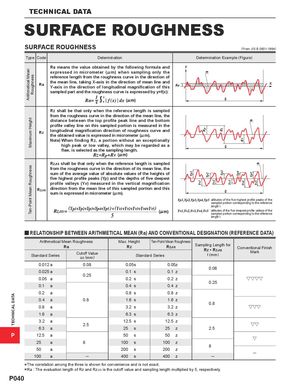
TECHNICAL DATA Arithmetical Mean RoughnessMaximum HeightTen-Point Mean Roughness TECHNICAL DATA SURFACE ROUGHNESS SURFACE ROUGHNESS (From JIS B 0601-1994) Type Code Determination Determination Example (Figure) Ra means the value obtained by the following formula and expressed in micrometer (! m) when sampling only the reference length from the roughness curve in the direction of Ra the mean line, taking X-axis in the direction of mean line andY-axis in the direction of longitudinal magnification of this sampled part and the roughness curve is expressed by y=f(x): Rz shall be that only when the reference length is sampled from the roughness curve in the direction of the mean line, the distance between the top profile peak line and the bottom profile valley line on this sampled portion is measured in the Rz longitudinal magnification direction of roughness curve andthe obtained value is expressed in micrometer (!m). Note) When finding Rz, a portion without an exceptionally high peak or low valley, which may be regarded as a flaw, is selected as the sampling length. RZJIS shall be that only when the reference length is sampled from the roughness curve in the direction of its mean line, the sum of the average value of absolute values of the heights of five highest profile peaks (Yp) and the depths of five deepest profile valleys (Yv) measured in the vertical magnification RZJIS direction from the mean line of this sampled portion and this sum is expressed in micrometer (!m). :altitudes of the five highest profile peaks of the sampled portion corresponding to the reference length l. :altitudes of the five deepest profile valleys of the sampled portion corresponding to the reference length l. y RELATIONSHIP BETWEEN ARITHMETICAL MEAN (Ra) AND CONVENTIONAL DESIGNATION (REFERENCE DATA) Arithmetical Mean Roughness Max. Height Ten-Point Mean Roughness RaStandard SeriesCutoff Value"c (mm)Rz RZJISStandard SeriesSampling Length forRz • RZJISI (mm) Conventional FinishMark 0.012 a 0.08 0.05s 0.05z 0.08 0.025 a 0.1 s 0.1 z 0.25 0.05 a 0.2 s 0.2 z 0.25 0.1 a 0.4 s 0.4 z 0.2 a 0.8 s 0.8 z 0.4 a 0.8 1.6 s 1.6 z 0.8 0.8 a 3.2 s 3.2 z 1.6 a 6.3 s 6.3 z 3.2 a 12.5 s 12.5 z 2.5 6.3 a 25 s 25 z 2.5 P 12.5 a 50 s 50 z 25 a 8 100 s 100 z 8 50 a 200 s 200 z ─ 100 a ─ 400 s 400 z ─ The **Ra : correlation among the The evaluation length three of Rz is shown for and RzJIS is convenience and is the cutoff value and not exact. sampling length multiplied by 5, respectively. P040 ]]]] ]]] ]] ]